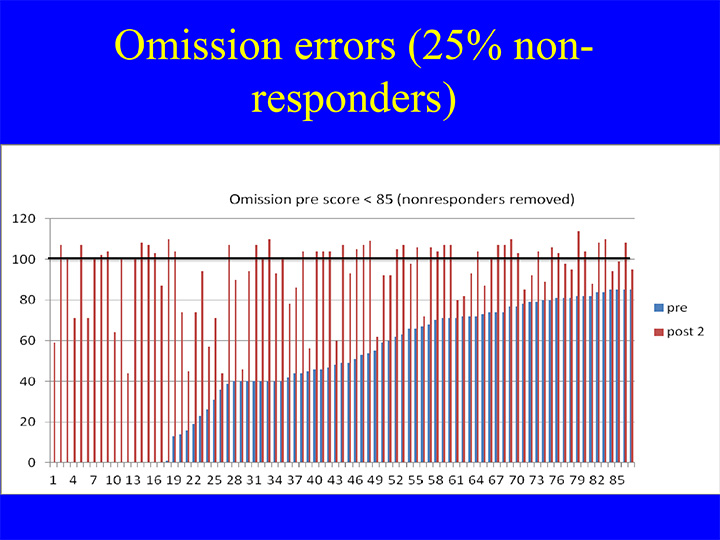
Figure 1. Pre-post change in the standard score for omission errors in a 21-minute Continuous Performance Test (CPT), for nominally twenty sessions of Infra-Low Frequency Neurofeedback. Data are plotted in rank-ordered fashion according to starting value. Values above 100 indicate saturation at zero omission errors. Observe that the probability of reaching such saturation is not strongly dependent on the starting value. Non-responders were excluded from the plot for reasons of visual clarity. Non-responders were 25% of the population.