Tracking EEG Amplitudes
by Sue Othmer | July 6th, 2006Several neurofeedback clinicians have been reporting that they are tracking EEG amplitudes during training as a means of identifying the optimum reward frequency. The reported observation is that inhibit amplitudes, or amplitudes across the spectrum as seen in a 2D spectral plot, fall significantly when training with a reward frequency which produces a calm and alert state. If this is so, even just some of the time, it might be possible and useful for the software to detect the shift and bring it to the clinician’s attention. It occurred to me that we need a design that would allow for tracking of the various amplitudes over a number of time scales, so we can all see what is happening and share that information more effectively.
It is not unreasonable to expect amplitudes to decrease within session with appropriate training. The EEG is highly state dependent and can be used, for example, in tracking state changes in an overnight sleep study. Our desired training state is one of calm eyes-open alertness in which all frequencies should be low amplitude. Low frequencies might increase in amplitude as people become sleepy, foggy, distracted, fidgety, etc. And high frequency amplitudes might increase with increased agitation or tension. These state-dependent shifts are in addition to any EEG rhythms or bursts that are related to brain dysfunction resulting from developmental delays, injury, or physiological disregulation. I really wouldn’t expect low frequency bursts related to seizure or migraine, for example, to shift within a session. But even a person with a highly disregulated EEG will also show shifts in background EEG frequencies with state changes.
So far I have not had much success tracking amplitudes within a session. I have certainly observed significant shifts in EEG amplitudes while training, but I haven’t been able to correlate that with the optimum reward frequency. In the first session, people often start with considerable muscle tension visible in their resting EEG. As I bring the reward frequency down to achieve more calming, there is often a point at which the EMG dramatically drops. I usually point this out to the client and inquire about awareness of muscle tension. But that is usually just a step on the way to a lower reward frequency that is more effective. I generally take the EMG drop as an indication that the shift down was useful, but not that we have achieved the optimum reward frequency.
With the programs I have been using, I really didn’t have a means of tracking amplitudes systematically. So I have created a new BioExplorer design that gives us several ways to see amplitude changes over different time scales. I hope that some of you will try this design and also store the EEG during some sessions that we can all review. If you record reward frequency changes and times, then we can all determine what correlations are observable.

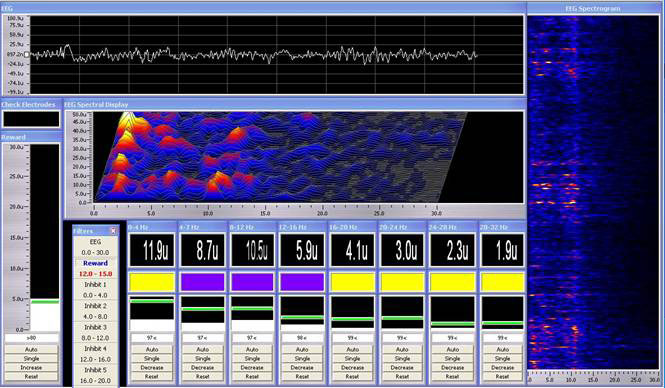
Instruments 1 displays 10 seconds of raw EEG and a compressed spectral array covering about 10 seconds. One could choose to display a 2D spectral, but the compressed spectral array has the advantage of showing some history so that changes are more easily discerned. The spectrogram along the right side of the display shows the amplitudes as if looking at the compressed spectral array from above. The spectrogram moves slowly from bottom to top and allows us to see changes over about a 5 minute time span. In this record one can see some persistent activity at about 10 Hz and some lower frequency activity as well. There seems to be an increase and decrease in amplitudes approximately every 2 minutes. Eight inhibit bands cover the range of 0-32 Hz. The amplitude in each band is displayed as a white bar that turns gray when it exceeds the inhibit threshold. The measured amplitude is also averaged over 30 seconds and displayed in microvolts. The blue and yellow boxes are direction of change indicators. Considering amplitude shifts over about one minute, the box for each band turns yellow if the amplitude is increasing and blue if it is decreasing. It is interesting to play this recorded 30-minute session, or the CESample1 included with BioExplorer using this design. The blue and yellow boxes shift quite consistently as the overall amplitude ebbs and flows.

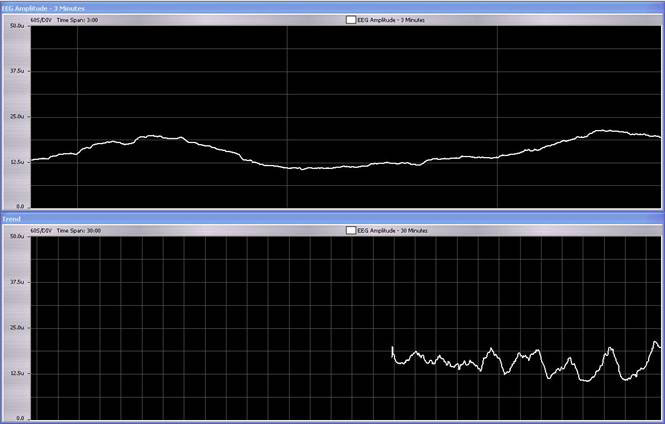
Instruments 2 displays the amplitude of the raw EEG over a 3-minute window in the top display and a 30-minute window at the bottom. There were no changes in reward frequency during this 30-minute record. But you can clearly see the amplitude increasing and decreasing over time.
You can download the BioExplorer EEG Info designs at www.neuroamp.com, including this new EEG Info 1 Channel Multiple Inhibits and Trends with Inner Tube, Particle Editor or Roller Ball. Roller Ball uses Instruments 2 for the game display, so the trend lines are only available with Inner Tube and Particle Editor designs. This 2-channel awake-state EEG recording (OESample1) can also be downloaded for replay.


