by Siegfried Othmer, PhD
 For more than twenty years we have been using either the TOVA or the QIKtest with anyone who is able to take the test, in order to track progress in training. Both tests yield an incredible amount of information that is directly relevant to our project of training the brain toward improved stability and self-regulatory competence.
The QIKtest emulates the TOVA and has been utilizing the TOVA norms. Therein lies a limitation, since the norms predate the age of video games. By now they are a quarter century old. We therefore expect to see a trend toward shorter reaction times at least among the younger generation. Also, the elderly seem to be holding up better than they did a quarter century ago for a variety of reasons, and we may see differences there as well.
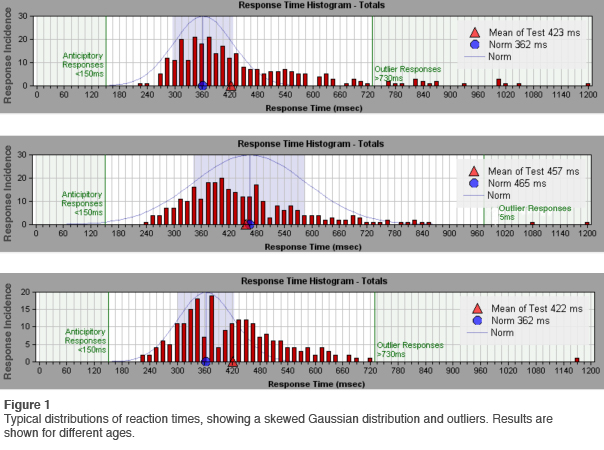
Some representative reaction time distributions are shown in Figure 1. Also plotted is the Gaussian distribution for the age-appropriate norm. The data are taken from sample QIKtest reports. It is immediately apparent that the data do not appear to be Gaussian-distributed. They exhibit a substantial skew. On top of that, there are occasional extreme outliers. A representative time series of reaction times is shown in Figure 2. The single outlier clearly does not belong to the set of more typical responses, and must be regarded as a member of a different class.
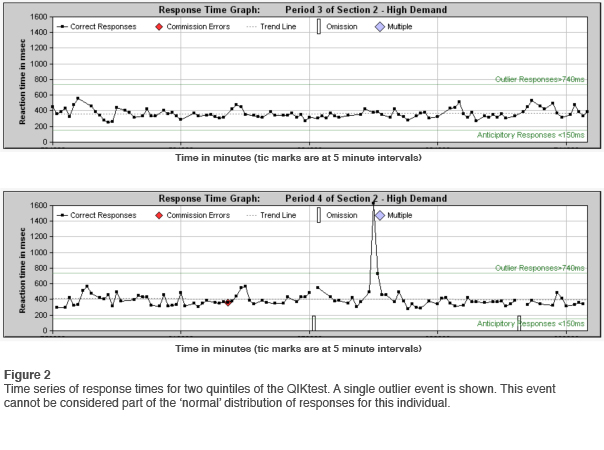
Once the distinct character of the outliers is recognized, it follows that these need to be excluded from the characterization of the typical reaction patterns, which brings up the need for a criterion to discriminate the outliers. For this purpose, it is necessary to evaluate the reaction time distribution statistically for a large sample.
As it happens, we have a unique opportunity to do that with the QIKtest, because all of the data sets analyzed over the years remain available for analysis. The resource consists of some 50,000 records, which gives us a generous sample for all age groups for both genders.
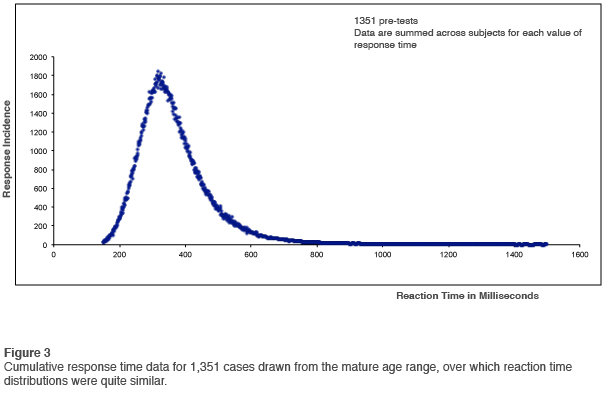
We started looking at this issue back in 2007, and our first initiative was to look at data over the age range in which reaction time distributions were very similar. Figure 3 shows the cumulative results for some 1,351 cases. Reaction times were assigned to bins of one millisecond width, and were then simply accumulated for all bins (out to 1500msec) for all cases. For example, the 302msec bin accumulated a count of 1,651, which meant that the probability of an event appearing in that bin was greater than unity for the typical test.
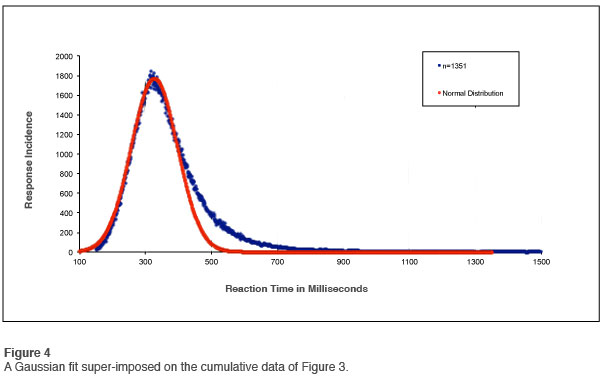
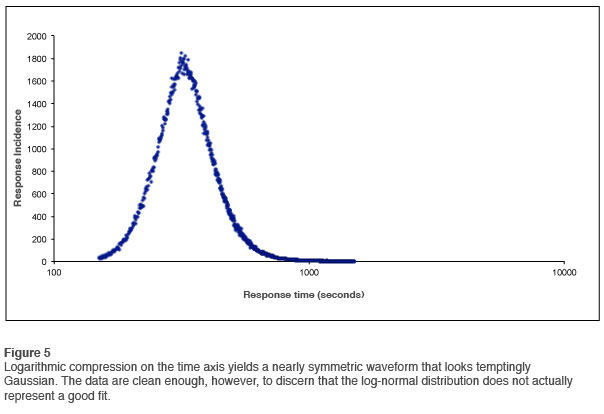
A distinct skew is seen in the plot, with the implication that this is characteristic of normal reaction time behavior. The skew is even more apparent when we apply a Gaussian fit to the data, as shown in Figure 4. One common technique of appraising such a skew is to perform a logarithmic compression on the horizontal axis, in order to assess whether the curve is “log-normal,” that is to say, Gaussian-distributed in logarithmic space. The results are shown in Figure 5. This curve does look Gaussian at first glance, and it would be tempting to just close the book on this subject. But then there are also the outliers… So there is clearly more to the story.
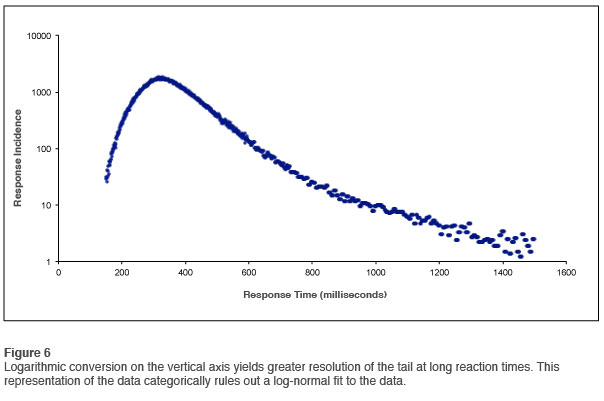
The outliers are such rare events that they don’t show up on the summary chart. Consequently, a different kind of analysis is called for. If we do a logarithmic conversion on the vertical axis we get access to the detail that is missed on the linear plot. The results are shown in Figure 6. This looks very different indeed. We note first of all that the data are well-behaved all the way out to 1500msec. We note secondly that there are no obvious discontinuities in the curve. It is not easy to segment it into different regions.
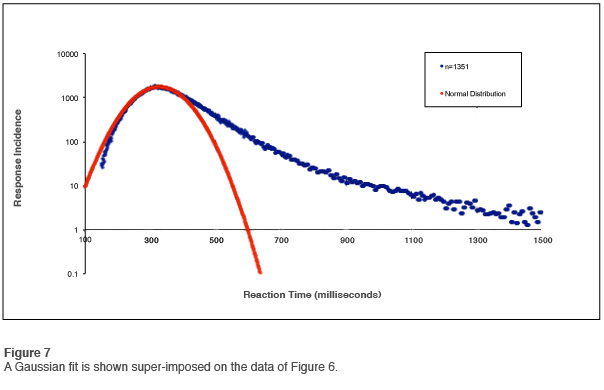
This becomes even more obvious if we plot the prior Gaussian fit on this curve, as shown in Figure 7. As soon as one inspects this curve, all interest in trying to fit these data to a log-normal distribution is lost. The tail of the curve is just too prominent. At one extreme the curve is entirely dominated by the outliers, and at the other it is dominated by a prominent Gaussian distribution.
There is one more obvious measure to take in order to get a grip on this strange distribution. If we take the existing mapping of the data (Figure 7) and perform a logarithmic compression on the horizontal axis, we obtain a representation of the data that is logarithmically arrayed in both dimensions. That is referred to as log-log format. The results are presented in Figure 8. We observe that the tail of the curve can be fitted in rough approximation with a straight line. A straight line on a log-log plot implies a simple power-law relationship. That is what is expected for a chaotic failure mode. Such a result is not terribly surprising. One might indeed expect that the occurrence of reaction time outliers is subject to the statistics of chaotic systems.
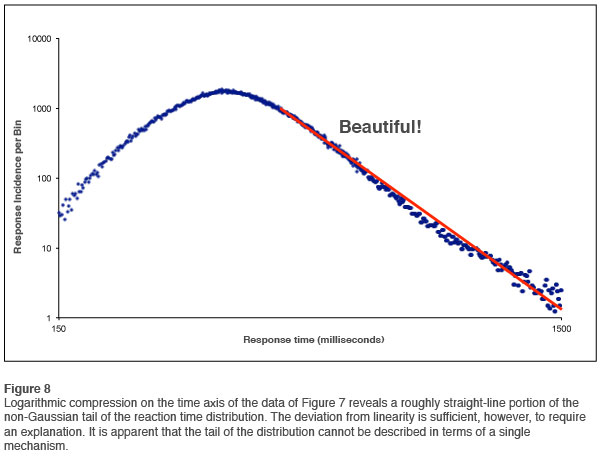
But it must also be acknowledged that the fit is only approximate. The data in Figure 8 are sufficiently well-behaved to be able to say that the curve is not quite linear. There is an obvious kink in it, which means that we are really dealing with two different distributions rather than one. Whereas the data are good enough to reveal the problem, they are not quite good enough to allow us to resolve it. In 2012 the analysis was run again with the larger database available at that time. This allowed the conundrum to be unpacked, a topic that will be covered in the next installment of this newsletter.
In summary, what is apparent by this point is that explicit account needs to be taken of the behavior of outliers, and they cannot be seen as a mere perturbation on Gaussian statistics. This does not, however, invalidate the determination of Gaussian fitting parameters for our purpose of establishing whether a correspondence exists between our current population-based data and the earlier TOVA norms. This, too, will be covered in the next installment of the newsletter on this topic.
Acknowledgement
All of the analyses for this report, and the ones to follow on this general topic, were performed by Marco Versace, who is also the author and developer of EEG Expert, our analysis program for both the TOVA and the QIKtest.