The Discovery of the Neureka! Protocol
by admin | August 8th, 2003Author: Jonathan D. Cowan, Ph.D., BCIACEEG
A small study done by Marcus Perman and Dr. Artur Pocswardowski at St. Lawrence University compared two protocols on the Peak Achievement Trainer with an untrained control group. This study was designed to test whether they could enhance performance in female undergraduates in just 8 sessions. The primary measurement that was used was the Integrated Visual and Auditory Continuous Performance Test (IVA).
A new protocol, which we have titled Neureka!, because it appears to respond to new and important experiences, produced an improvement of 23.8 in the standard score of the Full Scale Attention Quotient (FAQ) in just four 15-minute sessions. That’s 1.5 standard deviations in an hour of training! By the eighth session, this had dropped off to about one standard deviation (16.4 points) above the initial score.
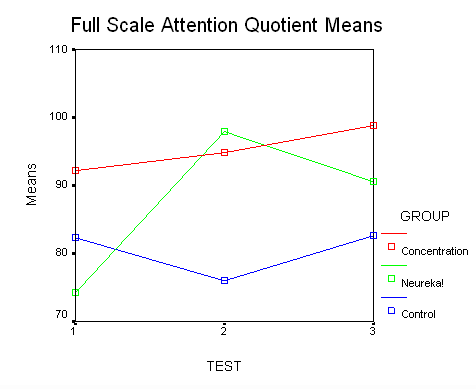
I analyzed the results of the study in two different ways, analysis of variance (ANOVA) and analysis of covariance (ANCOVA). The study was also designed to explore whether using the subject’s mood as a covariate would help us to understand the results. Analysis of covariance is a statistical approach that looks at the differences between the experimental groups and the subjects in the groups, and allows you to predict how much of the outcome is due to these differences. It then removes this source of variability from the analysis and tests the significance of the group differences–in this case, the analysis of covariance I performed was testing for the differences between groups in the gains in the FSAT and some of its subscales. The covariate I used was the Anger scale on the Profile on Mood States (POMS), a very well known and validated measure of mood (McNair, Lorr and Droppelman, 1971). The subjects in the control group were significantly less angry at the beginning of the experiment, p < .05.. It was also interesting to observe that the Anger scale was not strongly related to any of the other five scales on the POMS, which were all strongly related to each other.
The Analysis of Covariance improved the significance of the results considerably.
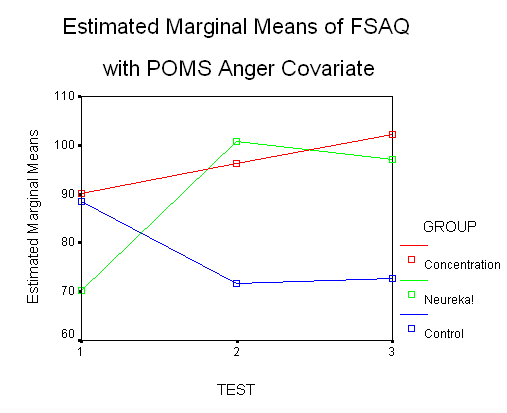
While the analysis of variance showed the improvement from Test 1 (pre-test) to Test 2 (after Session 4) in the group trained with Neureka! to be significant in comparison with controls, p < .05, analysis of covariance showed this to be more significant, p < .01. . By the third test at the end of the eight session study, this improvement was still significant, p < .001, with the analysis of covariance but not the ANOVA. In a small study (N = 5 per group), this type of fluctuation from test to test is not unusual, and was not significant here. The Neureka! group’s overall gain in the FAQ, averaged over the two tests, was significant at the p < .001 level with the covariance analysis, but was only a trend with the ANOVA, p < .10. Obviously, changes in mood do affect learning, and correcting for individual differences is useful.
The combination of the Peak Achievement Training Concentration protocol (InAll) and the Microbreak tape also showed gains of 6.6 points in 8 sessions, p < .01. Using the covariance analysis, the overall gain was significant, p < .05. However, the Neureka! protocol was significantly better than the Concentration protocol combination, p = .05.
The uncorrected ANOVA reveals that the stronger learning effects in the Neureka! group were on auditory, rather than visual attention.
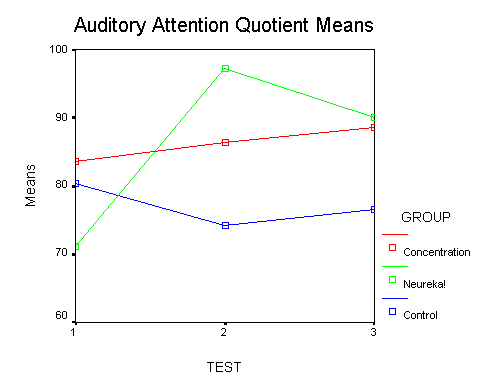
The Auditory Attention Quotient showed a significant overall gain, p < .05:while the Visual Attention Quotient was not significant. However, with the covariance analysis, both the Auditory Attention Quotient, p < .001, and the Visual Attention Quotient, p < .05, were significantly improved by the Neureka! training. The effects on the Auditory Vigilance Scale were significant, p < .05, while those on the Auditory Focus Scale were not.
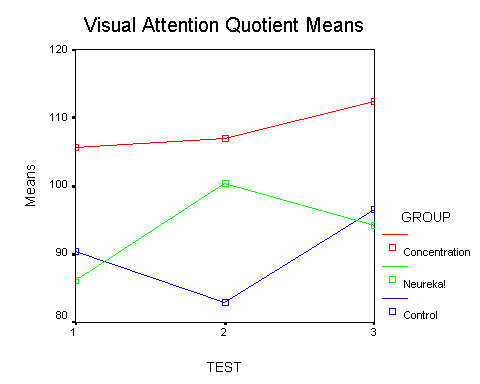
Looking at the Concentration group with the Covariance analysis, there is a significant overall improvement in the Auditory Attention Quotient, p < . 05, and a trend for the Visual Attention Quotient, p < .10.
If we can equate gains in the standardized scores in the Test of Variables of Attention (TOVA) and IVA for the sake of comparing this gain to Hershel Toomim's statistical average of 0.5 standardized score TOVA points per session in prior EEG studies, we find that the gain in the Neureka! group is considerably more. Based on the four 15-minute sessions, it is 5.95 points per session, while the 8 session average gain is 2.05. The Concentration group also beat the average, with 0.82 points per session. These were normal subjects, who may be expected to gain less than those who start off very low and regress towards the mean. The sessions were considerably shorter than the typical duration used in prior research.
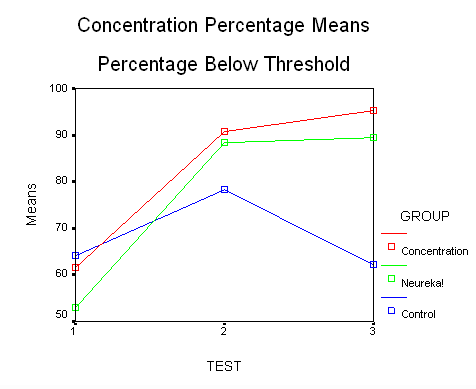
Did the experimental groups learn to hold the Concentration line down? They were tested for the percentage of time they could focus single-pointedly and hold it below 30 microvolts, using the InAll protocol. The improvements for both groups from Pre-Test to Post-Test were trends, p < .10. Here, once again, the anger covariate improved both effects to significance at the p < .05 level. It is interesting that the Neureka! group appears to have learned Concentration as well as the Concentration training group. However, this conclusion may actually be limited by the fact that two of the five students in the Concentration group started out above 90%. below threshold Further statistical analysis in which the beginning percentages are made approximately equal for each student may give us a better picture.
The InAll protocol used here to train for Concentration is one that I developed and legitimately patented. It was not based on the work of Dan Maust, as erroneously opined in a prior issue of this newsletter. To correct the record, at the Hot Tips session at AAPB in San Diego in 1997, I demonstrated suppressing theta on either side of FPz, referentially, shorting the two active electrodes. When I continued to see that the FFT showed that the brain’s response was to bring down a much wider band, I did the obvious thing and broadened my feedback band. Maust, on the other hand, had been doing bipolar “squash”, never referential, and the closest he’d come was F3-T3 and F4-T4. He did not recognize the relationship to focused attention until I showed it to him some time later, at Future Health 1998. He had only tried his own protocol three times on himself. He was astounded at the difference.
The results with Neureka are promising, but a larger study with better matched groups needs to be done. Neureka! is an improvement on a well-known but seldom-used training strategy with many studies that support its effectiveness;. The improvement may well have overcome the major problem with using this approach.
* * *
We thank Dr. Joe Sandford of BrainTrain (www.braintrain.com) in providing the IVA Tests for this study.
Jon


