LATEST
The Era of Precision Neuromodulation
Neurofeedback for ADHD
Endogenous Neuromodulation in the Infra-low Frequency Domain
Barry’s Leap
Can Endogenous Neuromodulation meet our society’s most critical…
Skip to content
What is neurofeedback?
How it Works
Research
Find a Provider
Newsletter
News & Media
Sue’s Book Corner
Education
Othmer Method Certification
Introductory Course
Mastering Neurofeedback
Next Level Neurofeedback
Synchrony
Alpha Theta
Advanced Clinical Summit
OnDemand Introductory Training
Video Library
The Clinic
Clinical Services
Testimonials
Meet the Clinicians
Schedule a Consultation
Find a Provider
Research
Member Services
Sign in
Join Professional Membership
Tech Support
Join Homecoming for Veterans
Manage Directory Listing
Shop
diagram2
← Previous
Next →
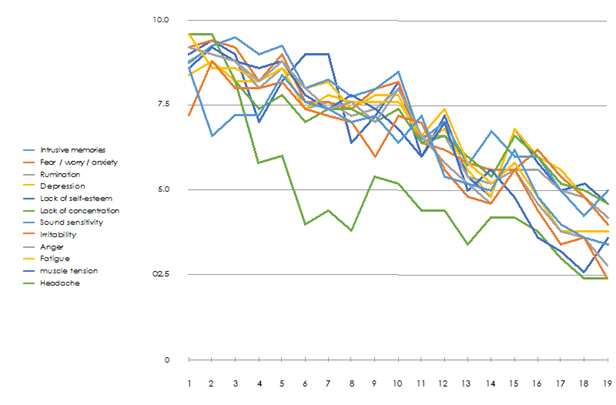
Diagram 2: The average/mean value of the patients’ symptom severity.
Leave a Reply
Click here to cancel reply.